解决matplotlib绘图中英文混用问题

最近在处理实验数据,因为有 c++基础,尝试使用 python 进行绘图。

目前遇到一个问题:想要在一张图中中文使用宋体,英文使用新罗马字体该如何解决?

在网上查阅了大量的资料,找到了几种解决办法,总结起来就 3 种:

  1. 全局使用中文,在需要使用英文的地方使用 latex 公式书写;
  2. 使用外部
  3. 合并宋体和新罗马字体为新字体timessimsun,重新导入 matplotlib

第一种方案:全局宋体+latex 新罗马

比如在绘制 text 时,英文使用 latex 公式进行书写,可将英文显示为新罗马字体。

1
2
3
4
5
6
7
8
9
10
11
12
import matplotlib.pyplot as plt
rc = {"font.family" : "Times New Roman",
"mathtext.fontset" : "stix",
}
plt.rcParams.update(rc)
fig,ax = plt.subplots(dpi = 300)
ax.set_xlabel(r'密度$\mathrm{kg/m}^3$',fontname = 'SimSun',fontsize = 20)
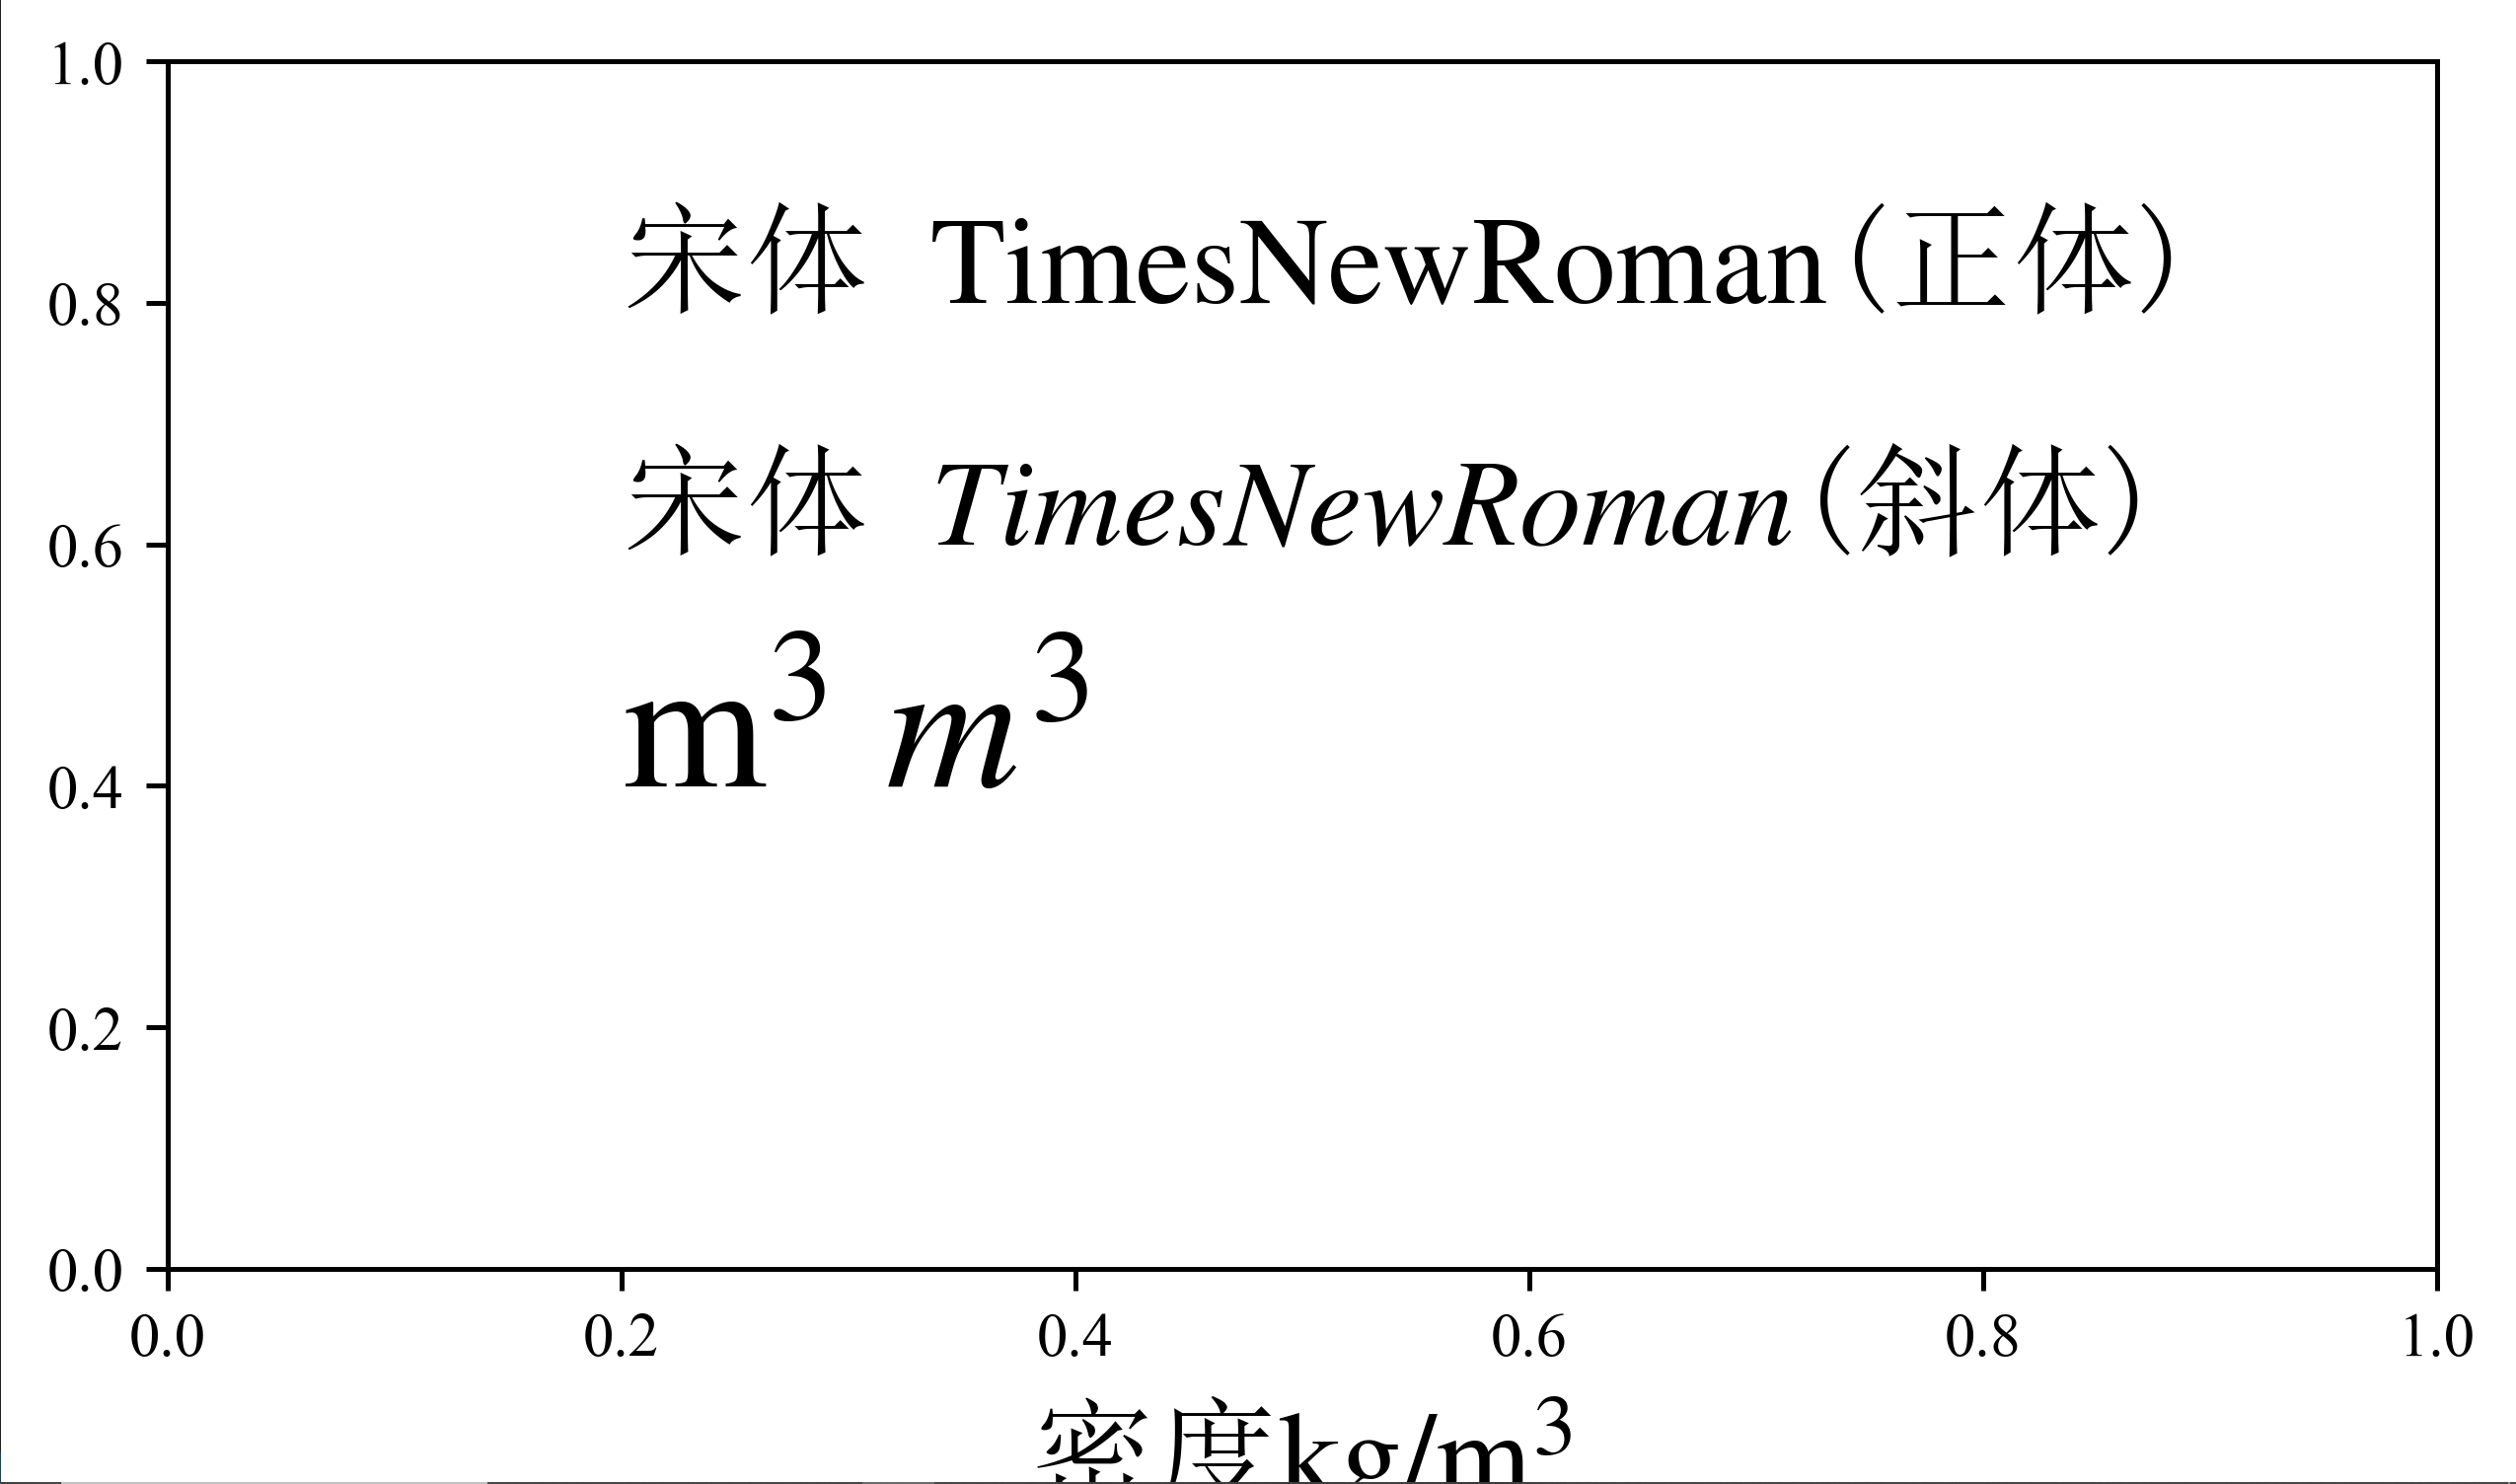
ax.text(0.2,0.8,r'宋体 $\mathrm{Times New Roman}$(正体)',fontname = 'SimSun',fontsize = 20)
ax.text(0.2,0.6,r'宋体 $Times New Roman$(斜体)',fontname = 'SimSun',fontsize = 20)
ax.text(0.2,0.4,r'$\mathrm{m^3}\ m^3$',fontsize = 30)
fig.tight_layout()
plt.show()
image-20240417004233122

这时可能还是不行,原因是matplotlib没有找到宋体

修改配置文件

C:\Users\23984\.conda\envs\py-data-deal\Lib\site-packages\matplotlib\mpl-data\matplotlibrc,也就是Python目录下的Lib\site-packages\matplotlib\mpl-data\matplotlibrc

修改字体类型为serif,并添加宋体
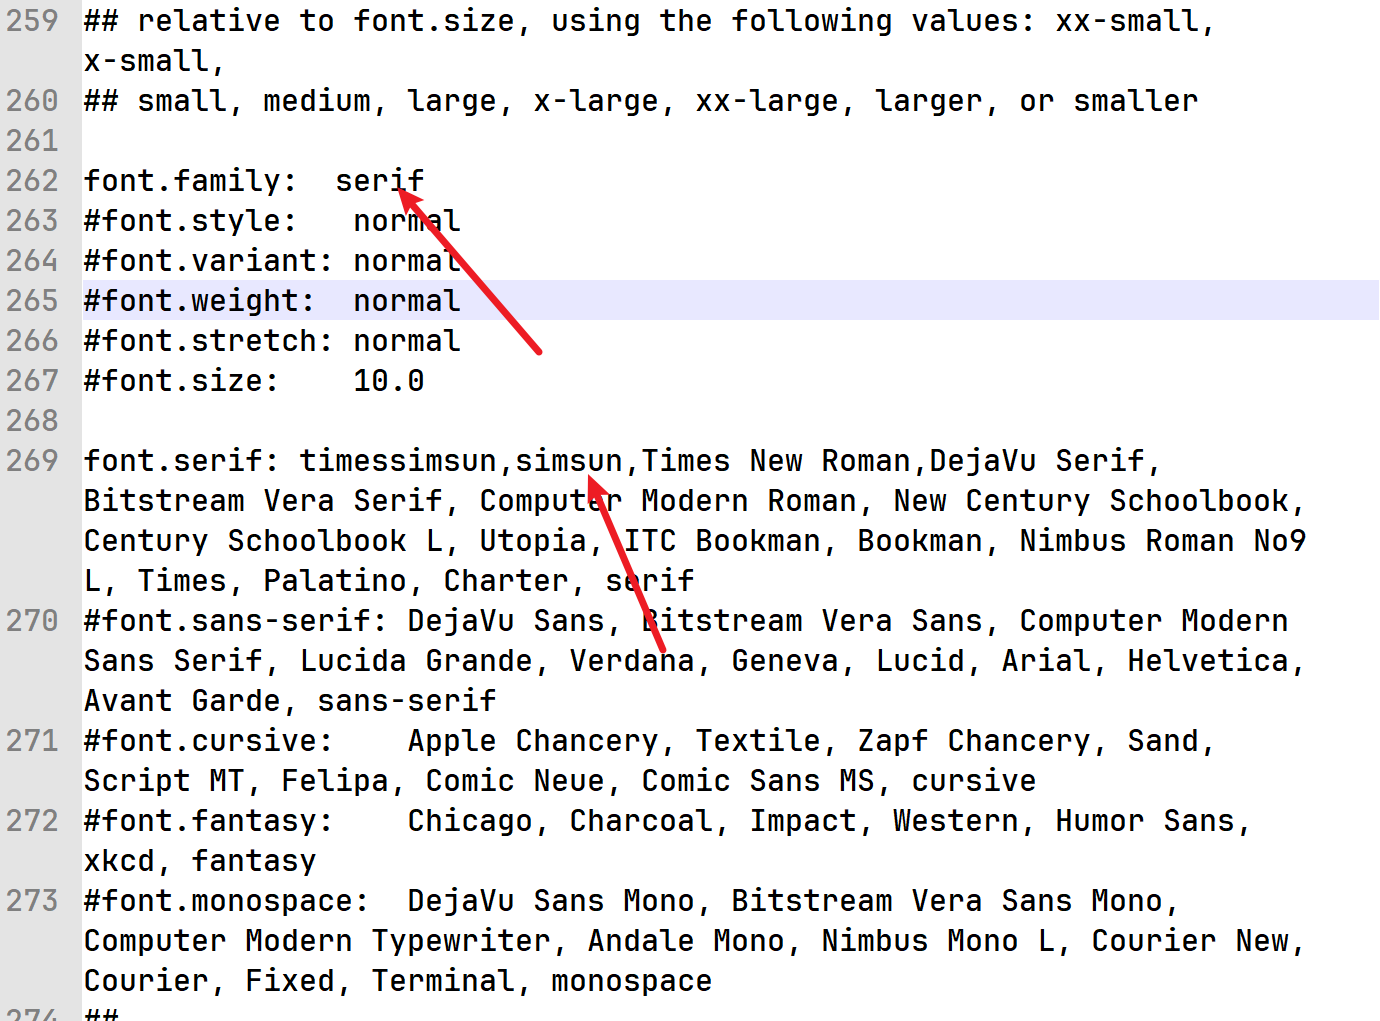
image-20240417010437557

更改缓存文件

C:\Users\23984\.matplotlib\fontlist-v330.json

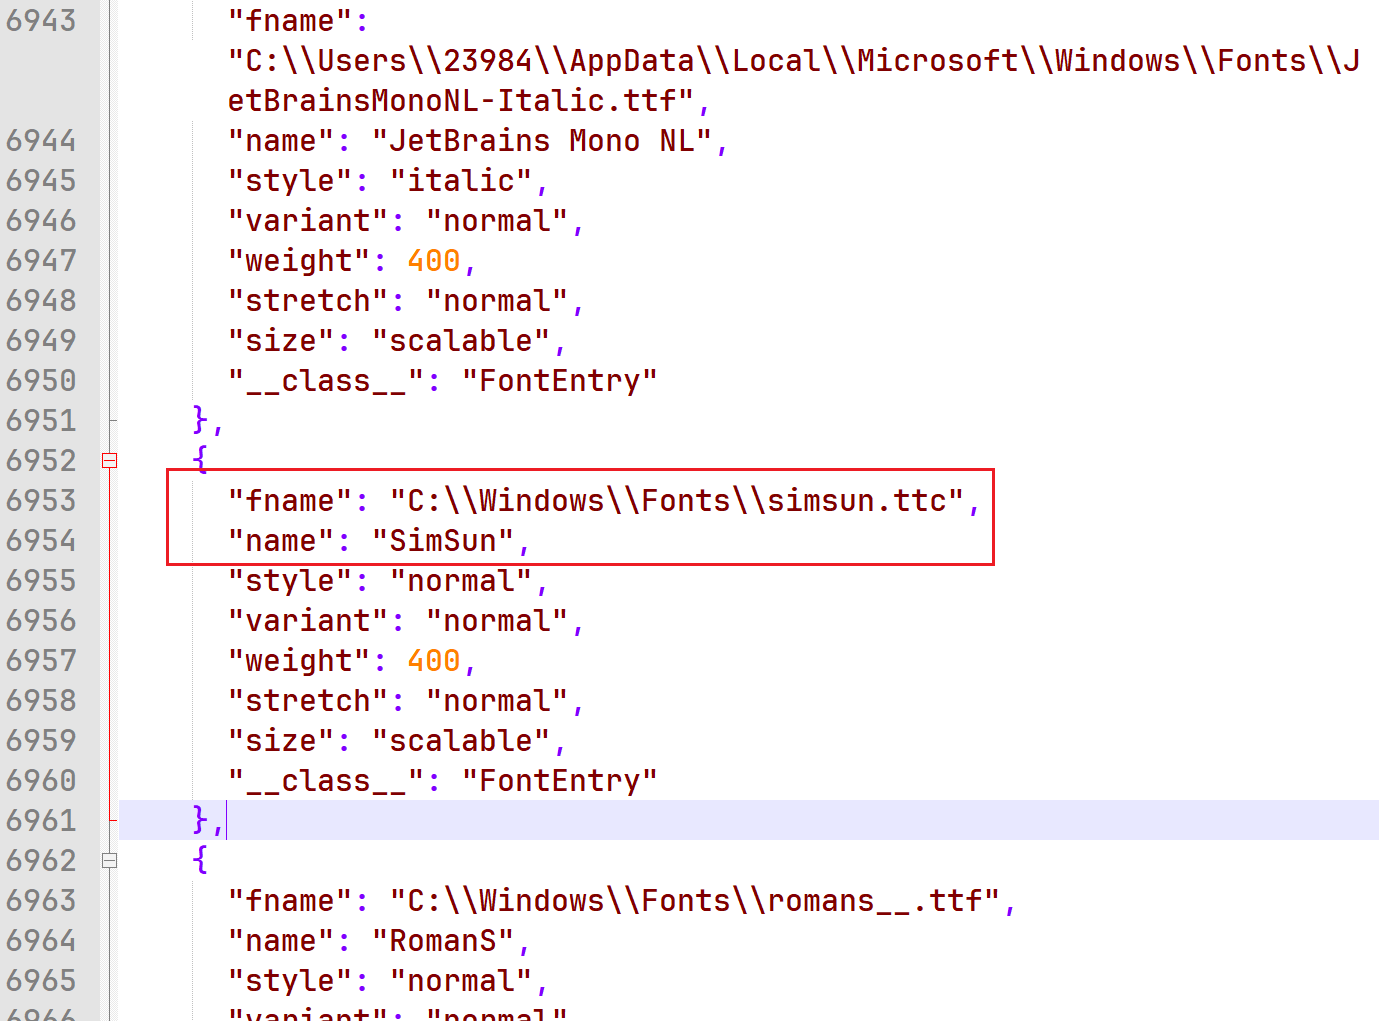
在 ttflist 中重新新增一份simsun字体,定位到字体存放的位置

这个字体可在电脑默认字体库中找到,在C:\Windows\Fonts目录下

image-20240417010608917

完成

但是这个方法有个很明显的局限性,就是需要手动在英文的地方输入 latex 公式,其一对不熟悉 latex 的伙伴不友好,其二若数字是存储在一个变量中如何在 latex 获取变量的值。比如在绘制 lengend 时,1000g/m3 中的 1000 是存储在动态变量中的,这时就不能通过第一种方法显示更改为新罗马字体。

第二种方案:latex 包

这种方案需要使用第三方 LaTex 包 ,xeCJK 是一个提供中文、日文和韩文支持的软件包。输入以下代码老是报错,目前我没有成功,所以此方案不做详细介绍,如果有小伙伴通过这种方法成功了,还请一起交流学习。

1
2
3
4
5
6
7
8
9
10
11
12
13
14
15
16
17
18
19
20
21
import matplotlib
mpl.use('pgf') # stwich backend to pgf
import matplotlib.pyplot as plt
plt.rcParams.update({
"text.usetex": True,# use default xelatex
"pgf.rcfonts": False,# turn off default matplotlib fonts properties
"pgf.preamble": [
r'\usepackage{fontspec}',
r'\setmainfont{Times New Roman}',# EN fonts Romans
r'\usepackage{xeCJK}',# import xeCJK
r'\setCJKmainfont{SimSun}',# set CJK fonts as SimSun
r'\xeCJKsetup{CJKecglue=}',# turn off one space between CJK and EN fonts
]
})
plt.rcParams['savefig.dpi']=300
plt.figure(figsize=(4.5, 2.5))
plt.plot(range(5))
plt.text(2.5, 2., "\CJKfontspec{SimHei}{黑体标注}")# Annotation by SimHei
plt.xlabel("宋体坐标标签(units)")# CJK&EN fonts mixed
plt.tight_layout(.5)
plt.savefig('examples.png')

第三种方法:合并新字体

这是比较推荐的一种方法,就是将新罗马和宋体两种字体合并为一种字体使用,需要使用字体合并工具,这里我直接在网上找到了别人合并好的,点击下载

将合并好的字体放在matplotlib包目录下,我这里使用的是anaconda字体文件夹是C:\Users\23984\.conda\envs\py-data-deal\Lib\site-packages\matplotlib\mpl-data\fonts\ttf,在Python环境下的Lib\site-packages\matplotlib\mpl-data\fonts\ttf
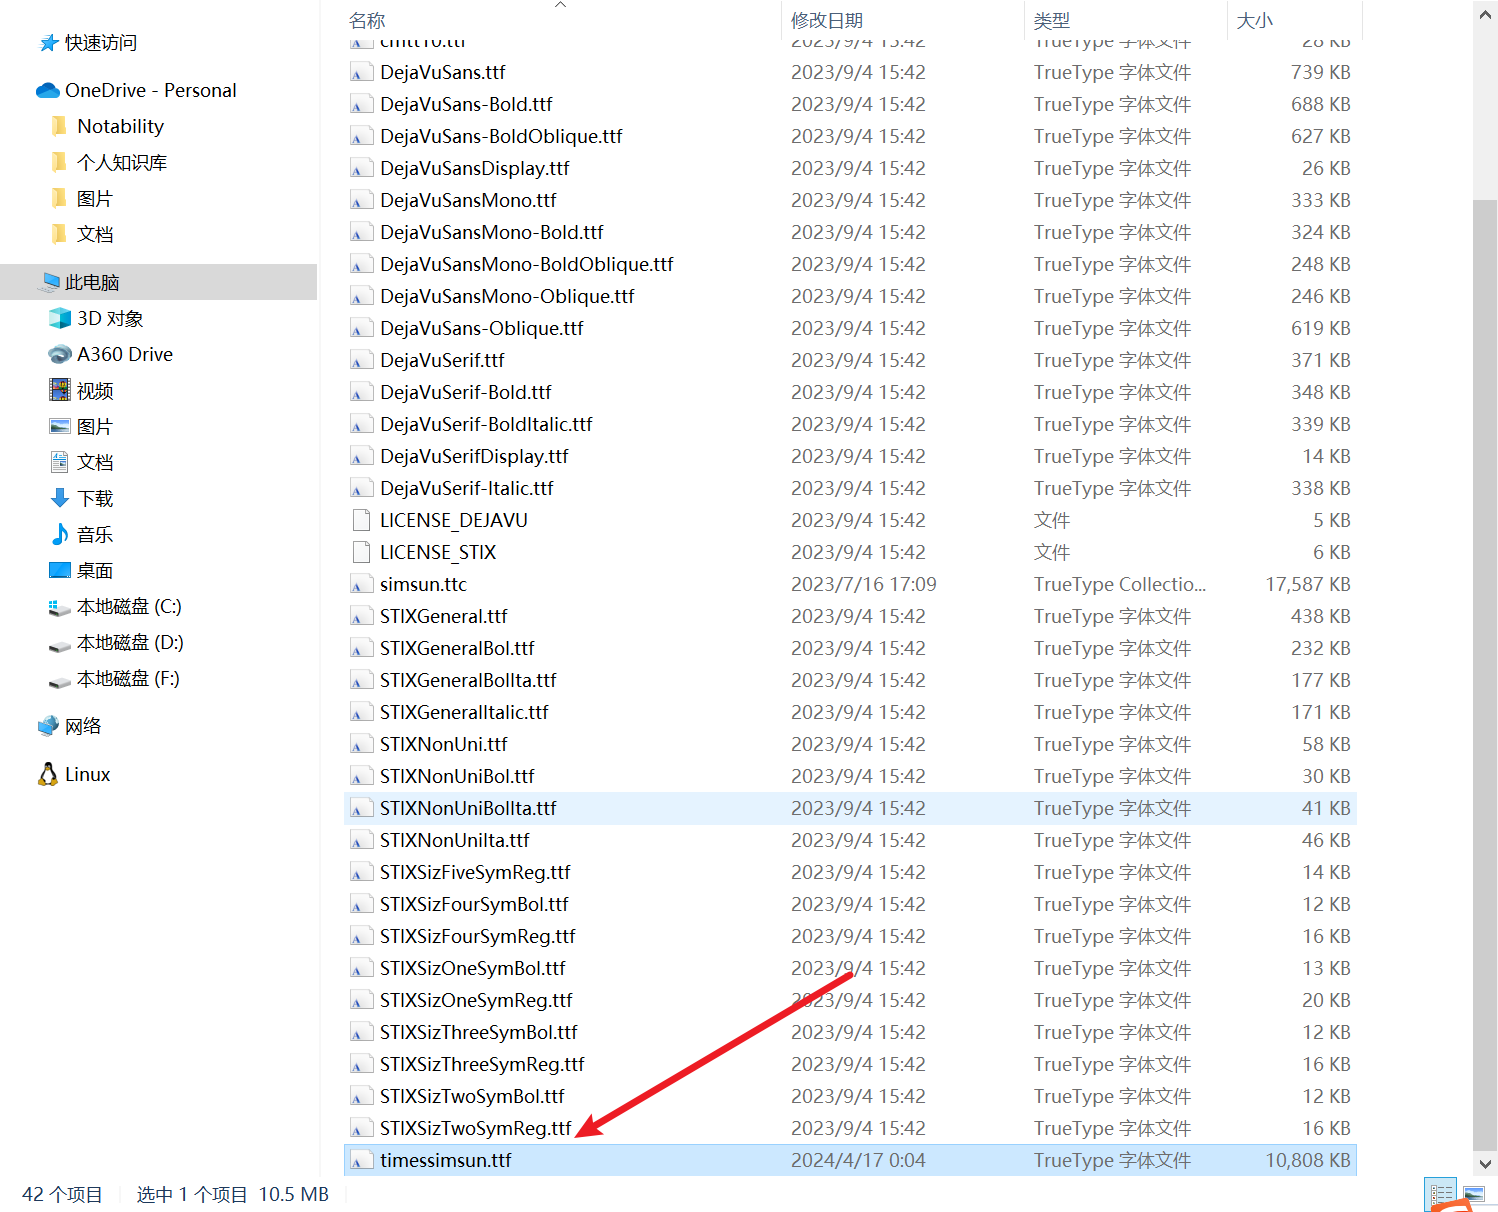
image-20240417005515518

修改配置文件

C:\Users\23984\.conda\envs\py-data-deal\Lib\site-packages\matplotlib\mpl-data\matplotlibrc,也就是Python目录下的Lib\site-packages\matplotlib\mpl-data\matplotlibrc

修改字体类型为serif,并添加新和成的字体
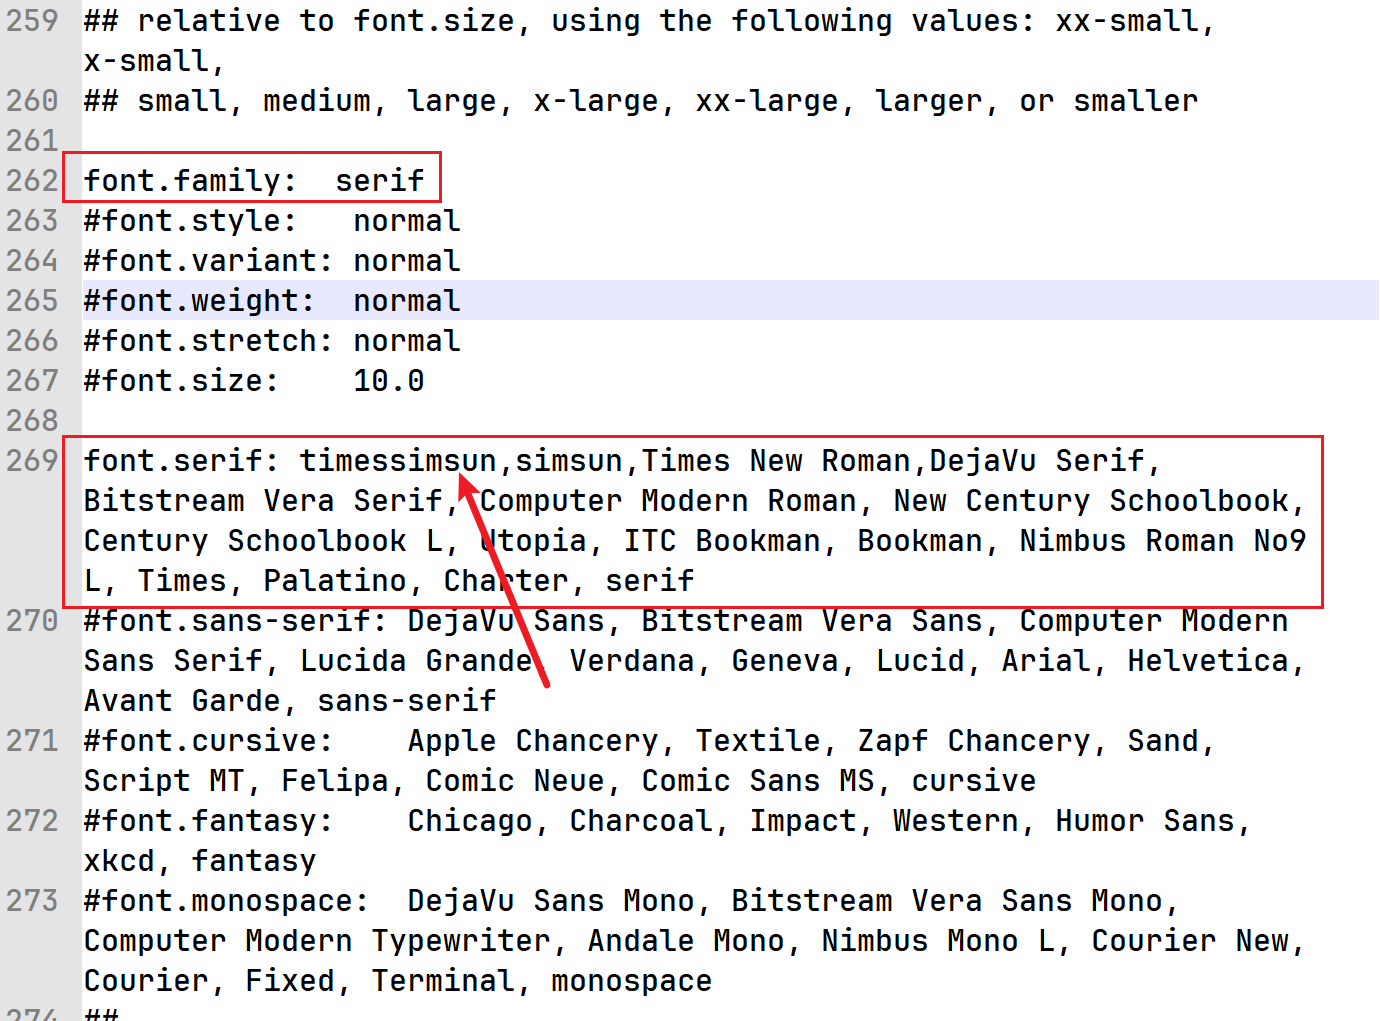
image-20240417005737211

更改缓存文件

C:\Users\23984\.matplotlib\fontlist-v330.json

在 ttflist 中重新新增一份timessimsun字体,定位到字体存放的位置
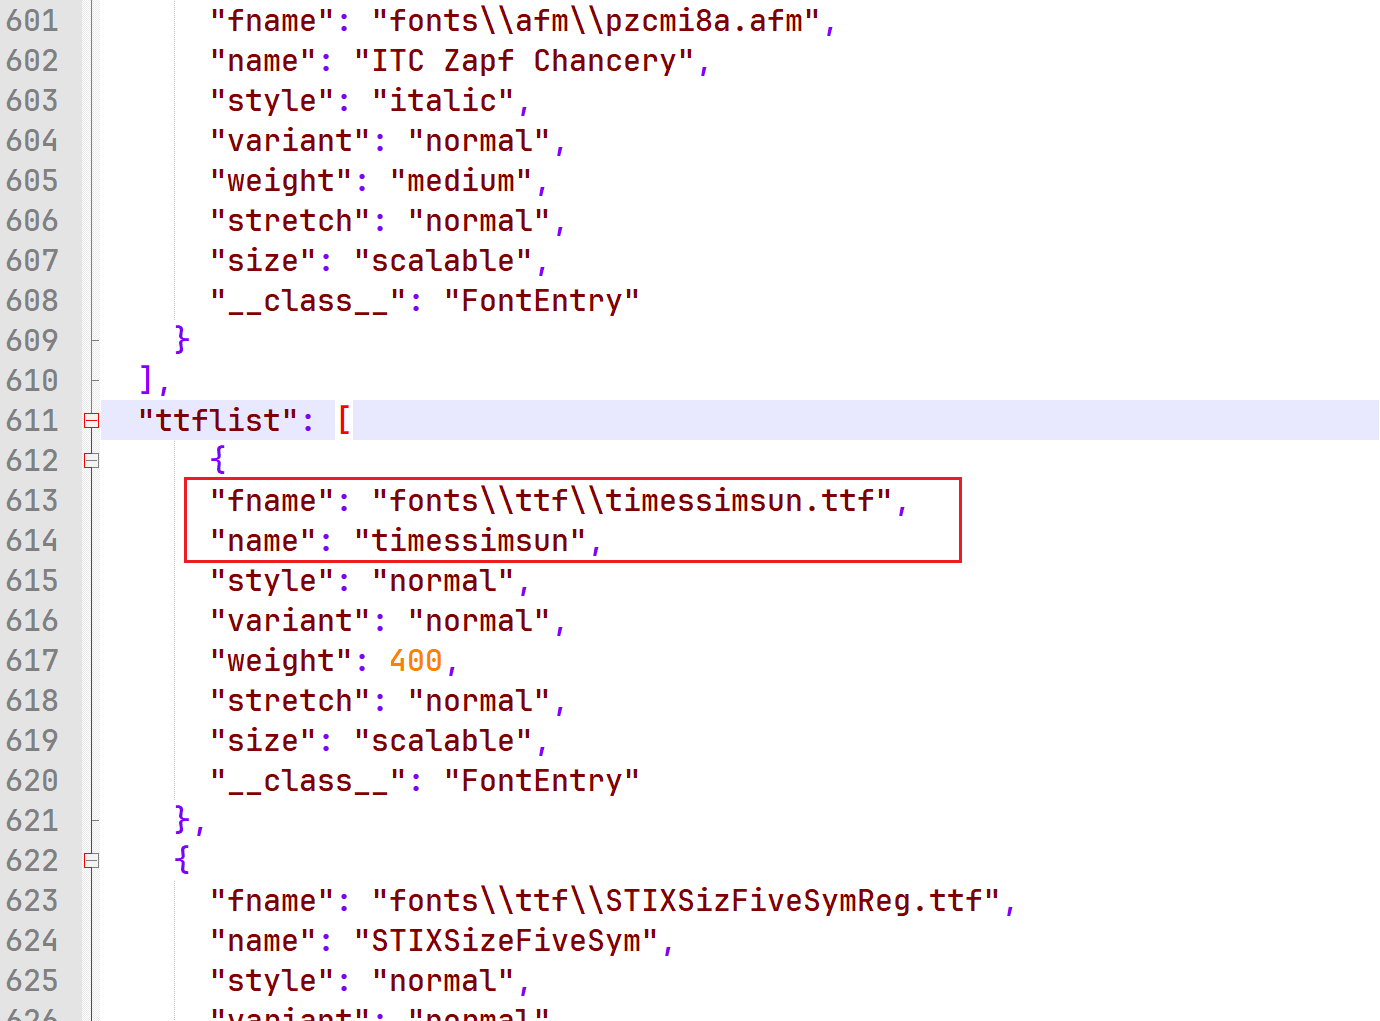
image-20240417005920759

测试代码

1
2
3
4
5
6
7
8
9
10
11
12
13
14
15
16
17
import matplotlib.pyplot as plt
from matplotlib import rcParams


config = {
"font.family":'serif',
"mathtext.fontset":'stix',
"font.serif": 'timessimsun',
}
rcParams.update(config)
plt.rcParams['axes.unicode_minus'] = False # 解决负号显示为方块的问题

fig,ax = plt.subplots(dpi = 300)
ax.set_xlabel(r'密度$\mathrm{kg/m}^3$',fontsize = 20)
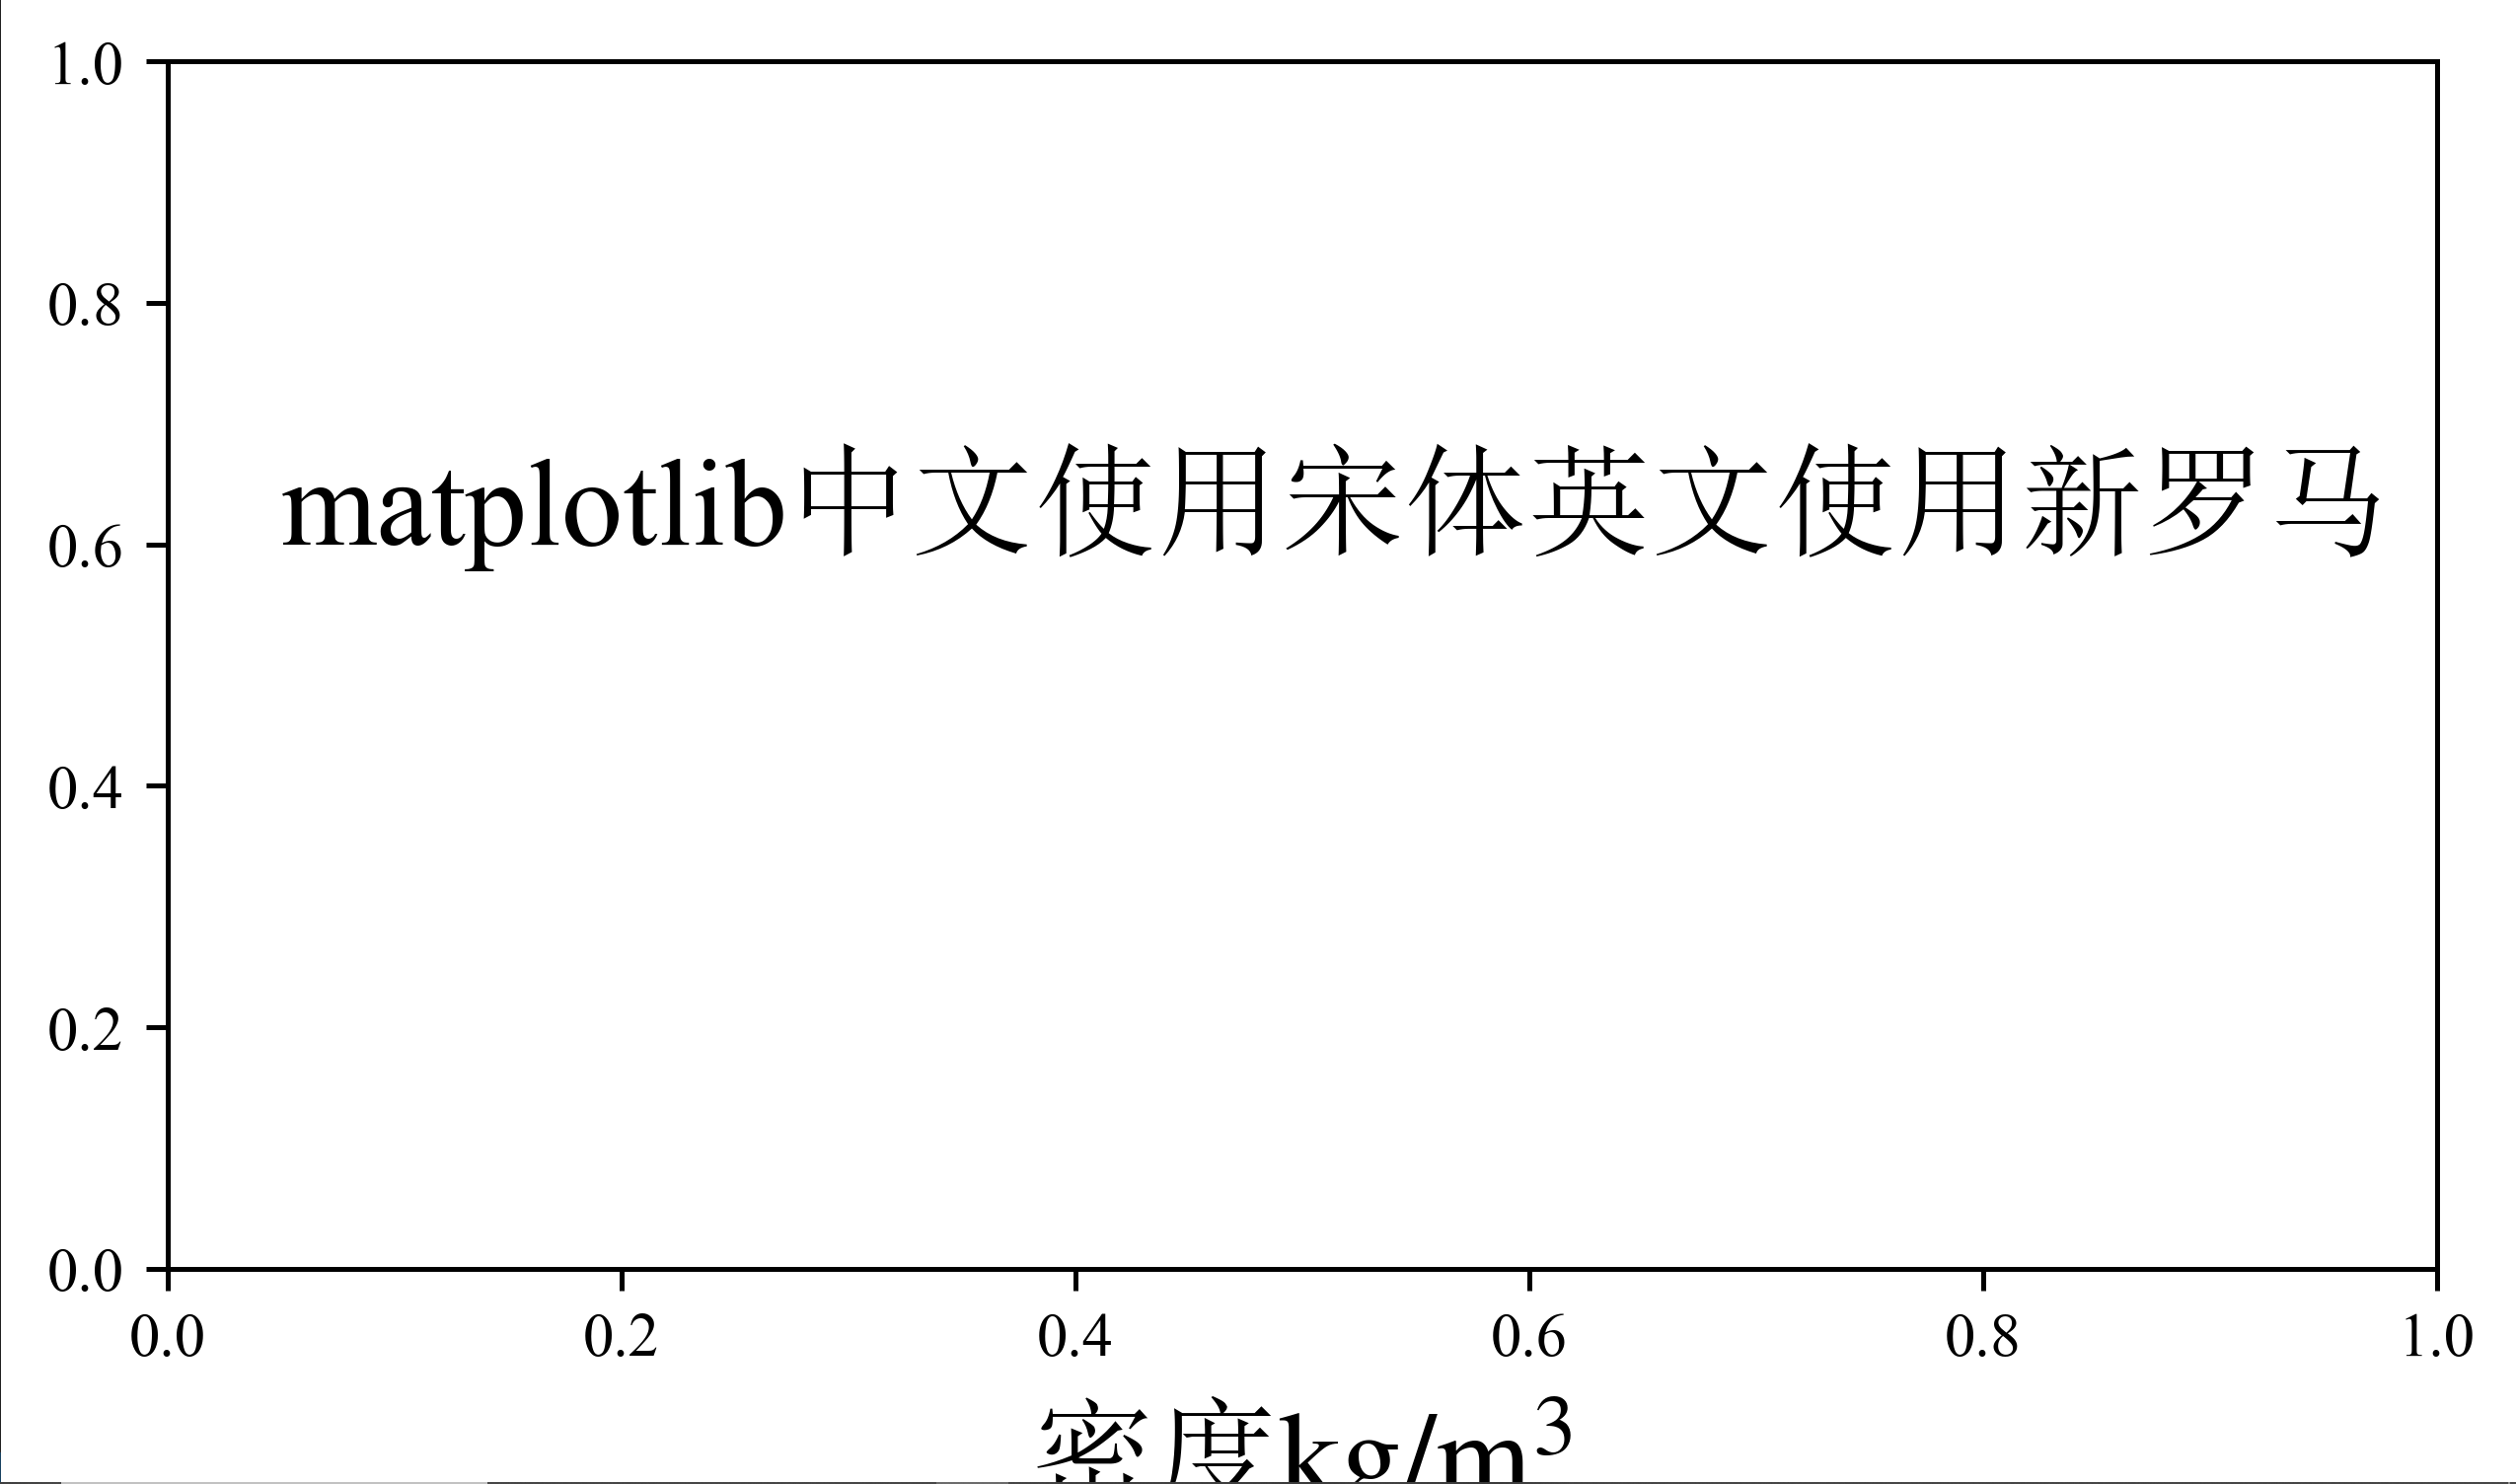
ax.text(0.05,0.6,r'matplotlib中文使用宋体英文使用新罗马',fontsize = 20)
fig.tight_layout()
plt.show()
image-20240417011423583

完成

参考链接:https://stackoverflow.com/questions/44008032/how-to-mix-chinese-and-english-with-matplotlib


解决matplotlib绘图中英文混用问题
http://example.com/2024/04/17/016 matplotlib绘图中英文混用问题解决/
作者
DB
发布于
2024年4月17日
许可协议